
Welcome!
Welcome to the SysFlow blog! We are thrilled you’re here!
tl;dr - this post kicks off the SysFlow blog and talks about the project’s vision, organization, and development roadmap.
Visibility into services and applications is critical for creating a strong security posture, and an opportunity to reduce cybersecurity risks. However, while the cloud facilitates standardized approaches to development and operations, the security monitoring market is still largely fragmented and dominated by proprietary data models. This impedes the implementation of common telemetry pipelines and shareable analytics, forcing administrators to source monitoring data from multiple agents to satisfy their workload visibility requirements.
A Format for Connected Observability
SysFlow is an open telemetry format designed to alleviate these issues. SysFlow lifts and normalizes the representation of system activities into a compact entity-relational format that records workload behaviors by connecting single-event and volumetric flow representations of process control flows, file interactions, and network communications. It drastically reduces data footprints over approaches that collect system calls and is particularly suitable for cloud-wide monitoring, stream analytics, and forensic investigation.
To illustrate, the following attack scenario illustrates how SysFlow can be used to uncover a targeted attack in which a cyber criminal exfiltrates data from a k8s service. During reconnaissance (step 1), the attacker detects a vulnerable node.js service that is susceptible to a remote code execution attack exploiting a vulnerability in a node.js module. The attacker exploits the system using a malicious payload (step 2), which hijacks the node.js server and downloads a python script from a remote server (step 3). The script contacts its command-and-control server (step 4), and then starts scanning the system for sensitive keys, eventually gaining access to a sensitive customer database (step 5). The attack completes when data is exfiltrated off site (step 6).
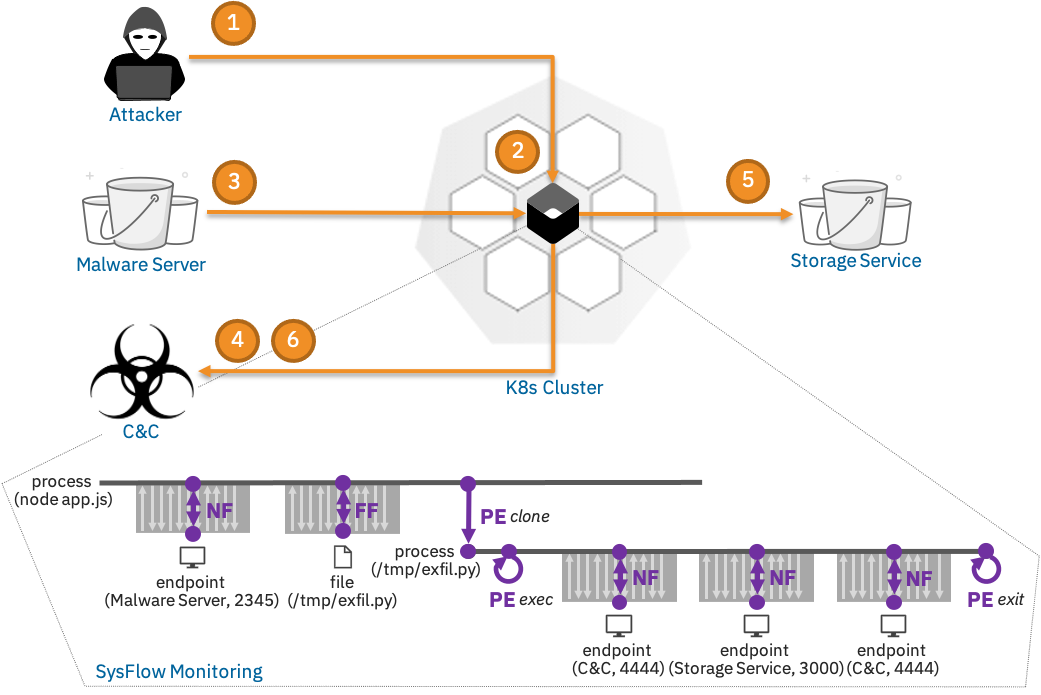
Note that SysFlow connects the entities of each attack step on the system. For example, the highlighted SysFlow trace maps precisely the steps of the attack kill chain: the node.js process is hijacked, and then converses with a remote malware server on port 2345 to download and execute a malicious script (exfil.py), which is eventually executed and starts an interaction with a command-and-control server on port 4444 to exfiltrate sensitive information from the customer database on port 3000.
This example showcases the advantages of applying flow analysis to system telemetry. SysFlow provides visibility within host environments, by exposing relationships between containers, processes, files, and network endpoints as events (single operations) and flows (volumetric operations). For example, when the node.js process clones and execs into the new process, these tasks are recorded as process events (PE), and when a process communicates with a network endpoint or writes a file, these interactions are captured and summarized using compact file (FF) and network (NF) flows. The resulting abstraction encodes a graph structure that enables precise reasoning and fast retrieval of security-relevant information, allowing automated defenses to detect and respond to attack incursions promptly, even before attackers can complete their missions.
Project Organization
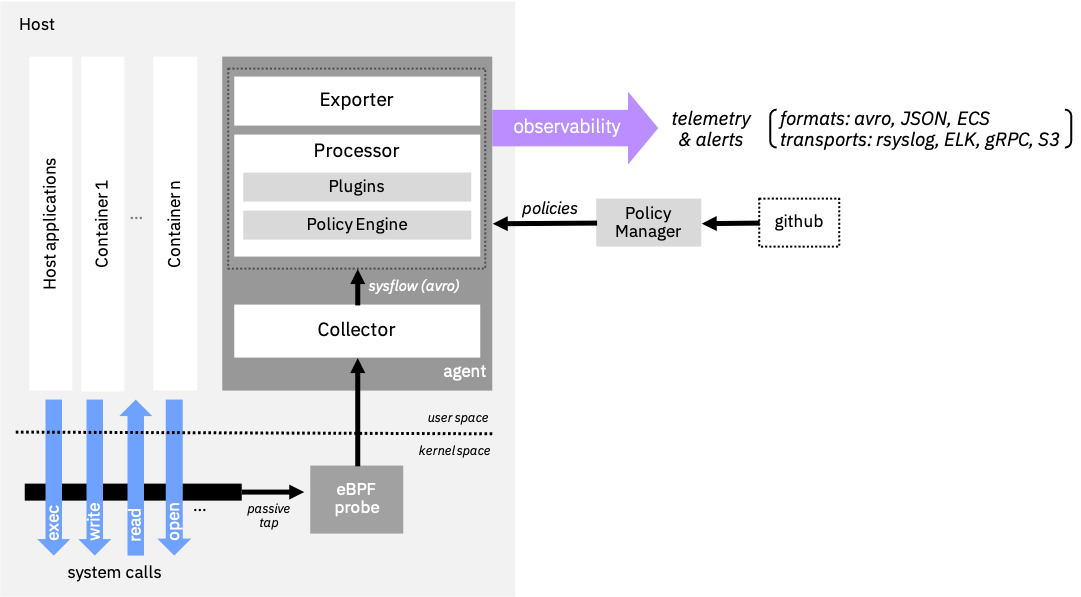
The SysFlow format is supported by an edge processing pipeline that aggregates event provenance information and supports real-time enrichment of the telemetry stream with attack TTP labels, environment metadata, and Kubernetes log data. The framework builds the plumbing required for system telemetry so that users can focus on writing and sharing analytics on a scalable, common open-source platform. Learn more about SysFlow in the documentation.
The framework is designed as a pluggable edge processing architecture which includes a policy engine that accepts declarative policies that support edge filtering, tagging, and alerting on SysFlow streams. It also offers several APIs that allow users to process SysFlow with their favorite toolkits. The pipeline can be deployed using Docker, Kubernetes, OpenShift, and bare metal/VMs. The SysFlow agent can be configured as an edge analytics pipeline to stream SysFlow records through rsyslog or to Elasticsearch, or as a batch exporter of raw SysFlow traces to S3-compatible object stores. An integrated Jupyter environment makes it easy to perform log hunting on collected traces. There are also Apache Avro schema files for SysFlow so that users can generate APIs for other programming languages. C++, Python, and Golang APIs are available, allowing users to interact with SysFlow traces programmatically.
The SysFlow framework consists of the following sub-projects:
- sf-apis provides the SysFlow schema and programatic APIs in go, python, and C++. It also includes a CLI utility for reading SysFlow traces in the command line (sysprint) and a pre-packaged Jupyter container for analyzing SysFlow catpures (sfnb).
- sf-collector monitors and collects system call and event information from hosts and exports them in the SysFlow format using Apache Avro object serialization. It builds atop the CNCF Falco libs (libsinsp/libscap) and eBPF/kernel module drivers for capturing system events.
- sf-processor provides a performance-optimized policy engine for processing, enriching, filtering SysFlow events, generating alerts, and exporting the processed data to various targets, including rsyslog and Elasticsearch. The policy language follows the CNCF Falco syntax and can interpret rules defined using Falco conditions, as well as rules specified using SysFlow attributes.
- sf-exporter exports SysFlow traces to S3-compliant storage systems for archival purposes.
- sf-policymanager implements an operator for managing and updating SysFlow policies from a git repository.
- sf-deployments contains deployment packages for SysFlow, including Docker, Helm, and OpenShift.
- sysflow is the documentation repository and issue tracker for the SysFlow framework.
Our CI/CD pipeline automatically builds and pushes docker images to Docker Hub and GHCR for all of of our projects. To get started with SysFlow, check our quick start guide.
Development Roadmap
Beginning now, we plan to establish a quaterly release cycle for SysFlow. We manage our backlog in a centralized git issue tracker, and we organize releases using git projects. Requests for feature enhancements can be made through the issue tracker.
Contributing
SysFlow is a young project but we enjoy seeing it mature into a fully-featured ecosystem for cloud-native telemetry and security analytics. We are an inclusive project and welcome contributions from the community!
If you enjoy coding and designing scalable software, and likes the project’s vision, read our contribution guideline and CoC, and consider becoming a contributor. Look for open or help wanted tags in our issue tracker. Commenting and helping us triage git issues are also great ways to help. We are also looking for a documentation czar for the project. Our projects are written in C++, Go, and Python, so there is room for everyone!
If you are using SysFlow in your projects, academic or otherwise, please shoot us a message on Slack. We would love to hear about it! If you published a research paper in which you used SysFlow, please let us know or send a PR to include the citation in our talks and publications list ;)
Connect with us on Slack! If you have any questions about SysFlow, we will be there to help.
Cheers!
– The SysFlow Team ♥