SysFlow ELK integration
As of release 0.3.0-rc2, sf-processor can write SysFlow telemetry records to Elastic!
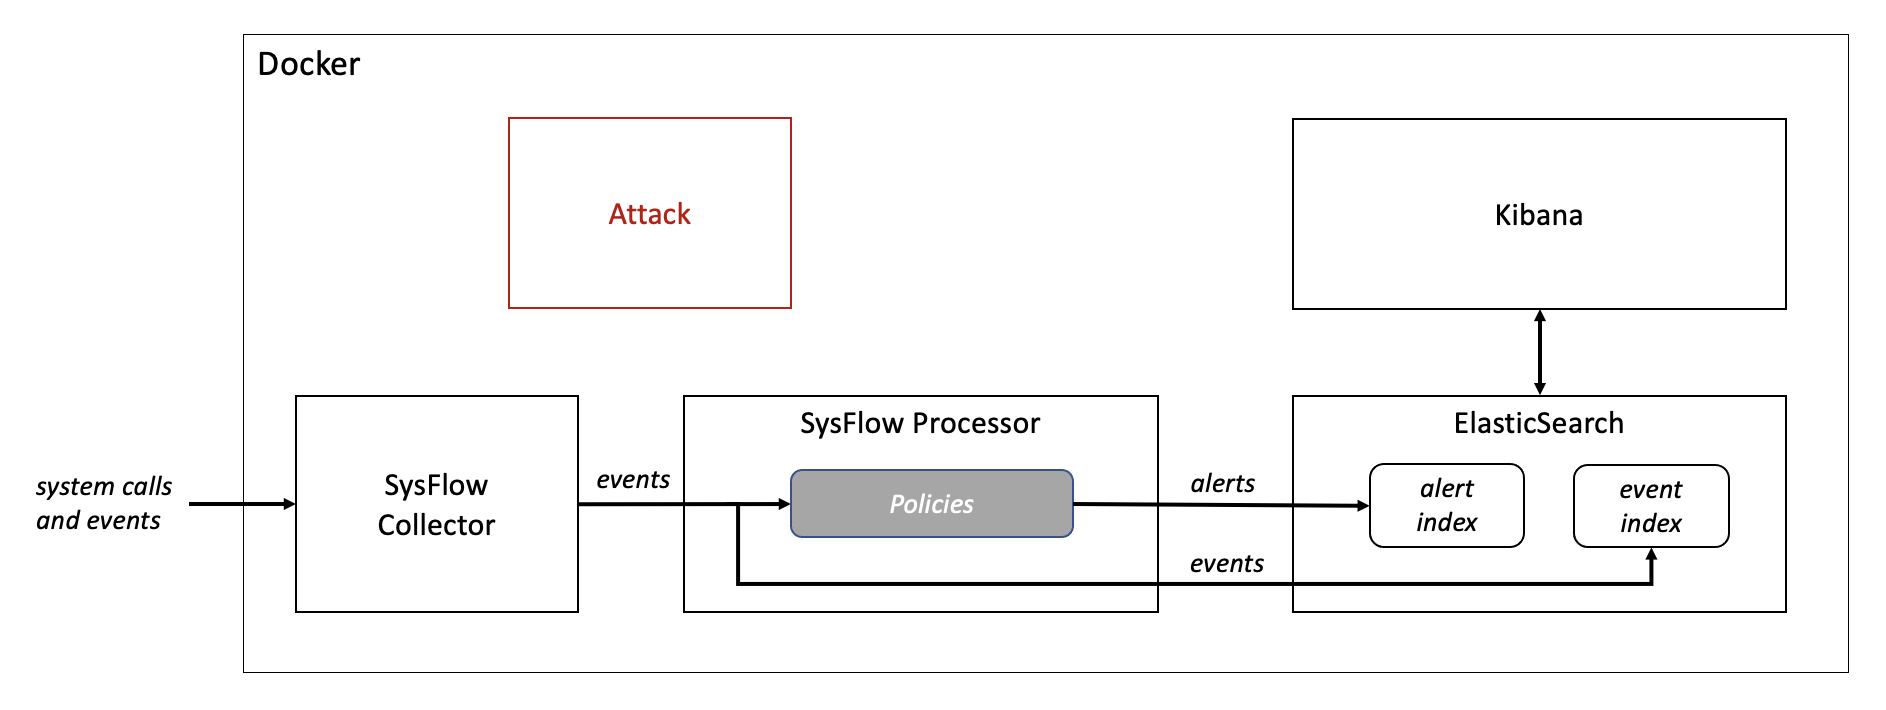
To illustrate this new feature, we have created a tutorial that showcases the integration of SysFlow with ELK. The setup is based entirely on Docker. It uses the SysFlow docker deployment consisting of sf-collector and sf-processor containers, and utilizes Anthony Lapenna’s ELK Stack on Docker to deploy ElasticSearch to store and query SysFlow data and Kibana for visualisation. A fifth container acts as an attacker and executes a set of commands belonging to the Discovery and Command and Control techniques of the MITRE ATT&CK® framework.

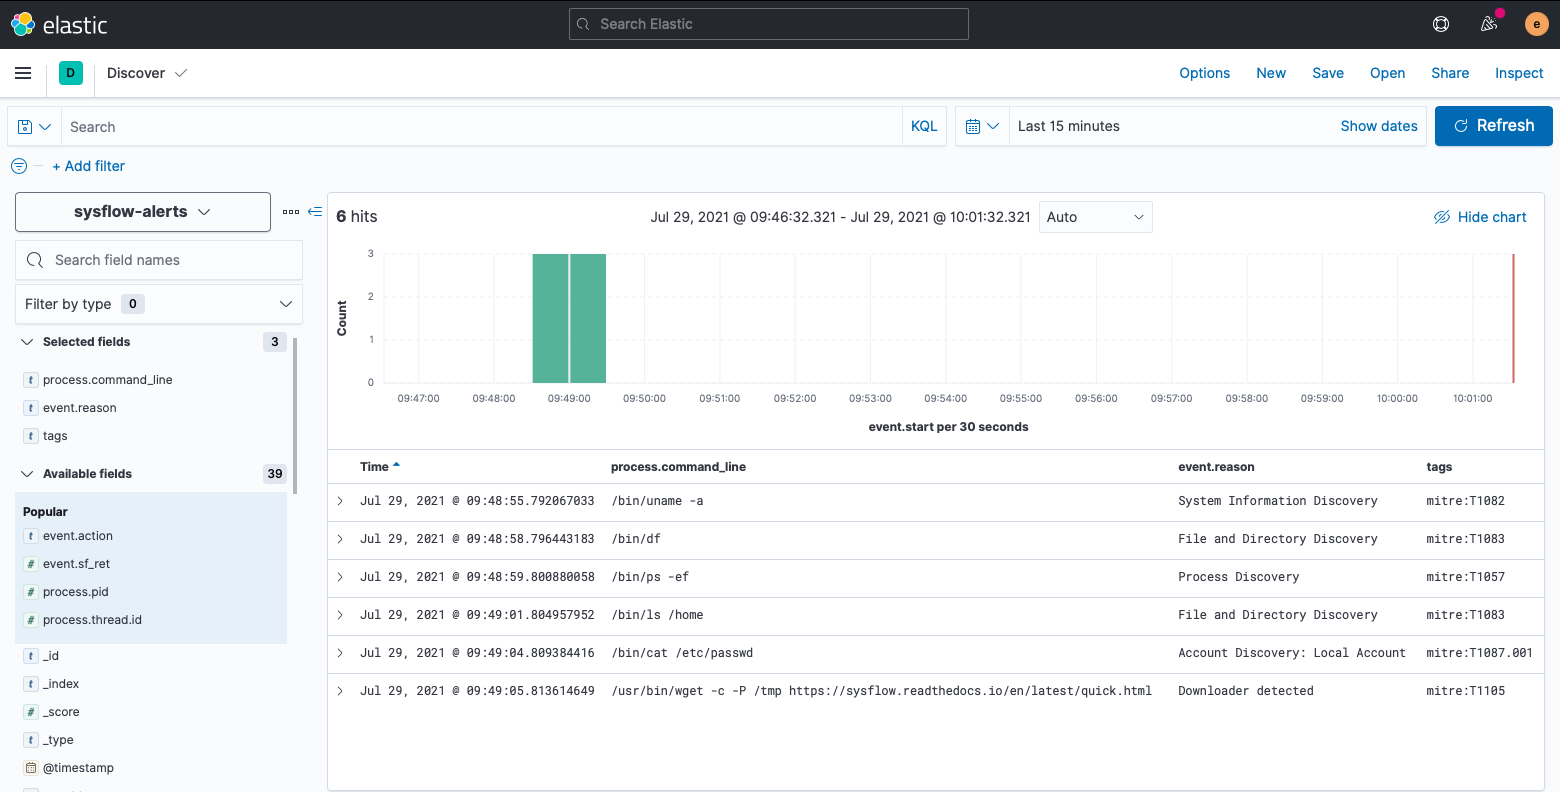
SysFlow collects the telemetry information created by the attack container. On this stream of raw events, SysFlow applies a custom processing pipeline that stores SysFlow data in two Elastic indices. One part of the pipeline uses rules for detecting the potential use of MITRE ATT&CK® techniques, generates alerts for matching SysFlow records, enriches them with the corresponding MITRE technique tags, and writes these alerts to an Elastic index. The second part of the pipeline stores the raw SysFlow events in a separate Elastic index for in-depth investigation of alerts. The pipeline converts SysFlow alerts and raw SysFlow events to Elastic Common Schema before indexing them into ElasticSearch. The contents of both indices can be visualized using Kibana.

Check this exciting new integration out for instructions on how to run the code yourself, a description of the pipeline configuration, and a detailed explanation of the results!
