
Getting started with the Open Hunting Stack in Hybrid Cloud with Kestrel and SysFlow
Today, we are going to discuss how to combine SysFlow, Kestrel, and ELK (or simply Elastic) to enable threat hunting in a hybrid cloud environment. This post was adapted from Xiaokui Shu’s tutorial originally published on the OCA Blog.
Kestrel is an open-source threat hunting framework that embeds a declarative language enabling threat hunters to focus on what to hunt rather than how to hunt. While SysFlow provides visibility, data enrichment, and edge analytics into each cloud endpoint, Kestrel + Elastic enable rich data queries combining data across nodes in a systematic and reusable format. This blog will discuss the setup of the open threat hunting stack presented at Black Hat Europe 2021. In our session An Open Stack for Threat Hunting in Hybrid Cloud With Connected Observability, we hunt an APT in a hybrid cloud environment.
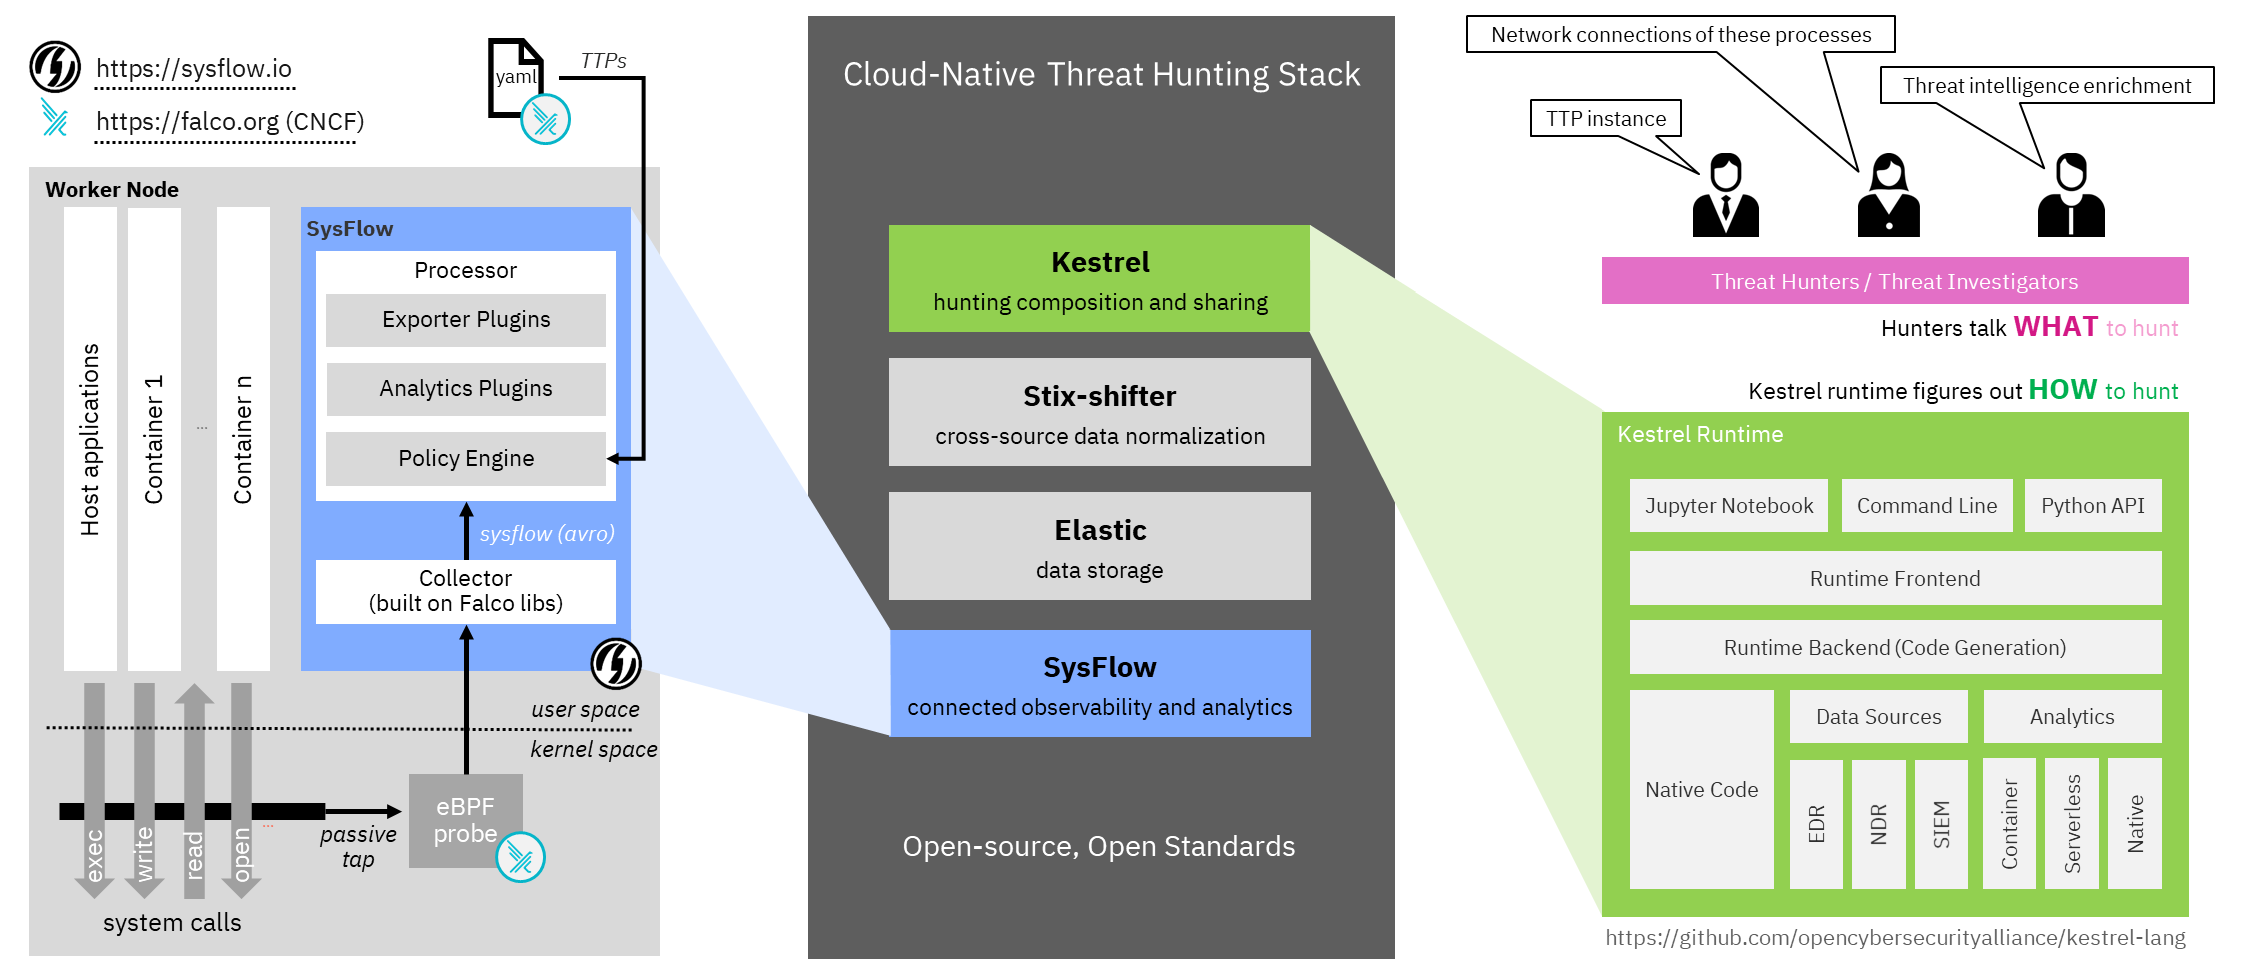
The above figure shows the open hunting stack and consists of four components:
-
SysFlow is an open system telemetry format that lifts raw system telemetry into a behavioral format, which records how processes and containers interact with their environment. SysFlow is designed to connect events together and create custom analytics either on the edge, or centrally.
-
Elastic (ELK) acts as a central data storage and retrieval for SysFlow telemetry and alerts (e.g., tagged with MITRE ATT&CK TTPs).
-
STIX-shifter provides federated search to achieve cross-source queries.
-
Kestrel provides the language to compose, share, and reuse huntflows.
Setting Up Elastic
First, we must setup the central Elastic data store, which will store all alerts and telemetry generated from the SysFlow agents. It is optional to install the entire ELK: Elasticsearch, Logstash, and Kibana.
There are four options to setup Elasticsearch:
-
Try it for free as a cloud service on AWS/Azure/GCP.
-
Spin up a Elasticsearch container in any public/private cloud.
-
Install and host a dedicated Elasticsearch server.
-
Deploy with one SysFlow Agent on a single node.
After deploying Elastic, note the domain/IP and port of
the Elasticsearch service. For this scenario, we pretend the configuration is: elastic.ourcloud.com:9200.
Setting Up SysFlow
SysFlow provides connected observability into cloud workloads. It efficiently monitors system calls using eBPF (Falco) and lifts the huge number of low-level system call events into summarized flows such as FileFlow and NetworkFlow to better organize telemetry data. SysFlow also performs real-time analytics, e.g., tagging ATT&CK TTPs encoded as Falco rules and provides a framework to build your own custom plugins.
SysFlow has two major components: Collector and Processor, which will be executed as two containers in the endpoints we want to monitor.
Depending on the cloud environment, e.g., Docker/Helm/OpenShift, we can follow
the detailed SysFlow deployment
instructions to start
the two SysFlow containers. For simplicity, we have developed a set of
scripts to connect the SysFlow Agent to ElasticSearch. Note, there are two versions of the
deployment scripts. Files with no_elk mean that the ELK stack is being deployed separately
from the SysFlow agent as a central storage server.
The others assume a single node deployment where the agent and the ELK instance are deployed
together on the same node (as in Elastic setup option 4 above).
First, let’s clone the sf-deployment repo and use the deployment scripts in its /integrations/elk/sf/ directory.
For simplicity, we will instruct SysFlow to monitor our targeted container workload by modifying the configuration as follows:
-
What to monitor. Set
container.name=container1in the .env.no_elk file to monitor the container namedcontainer1in our cloud. This condition instructs the collector to pass only records from this container (by default, SysFlow monitors the entire endpoint environment). -
The location of the Elastic Server. Replace
172.17.0.1:9200withelastic.ourcloud.com:9200with the credential of our Elasticsearch service in the pipeline.tee.no_elk.json file. Note that this must be done in two sections since the pipeline defines two exporters writing to individual Elastic indices which in our case are hosted on the same Elastic instance. -
The names of the alert and event indices inside Elastic. Replace
sysflow-alertsandsysflow-eventswithcontainer1-sysflow-alertsandcontainer1-sysflow-eventsin the pipeline.tee.no_elk.json file.
Next, let’s start SysFlow containers and watch data flowing into Elastic:
# should be executed in directory /integrations/elk/sf/
make -f Makefile.no_elk run
Setting Up Kestrel with STIX-shifter
Assuming we will write and execute Kestrel hunt playbooks in Jupyter Notebook, let’s install the Kestrel runtime on our hunting machine (either a local laptop or a dedicated hunting VM in our cloud). We will follow the Kestrel Installation Guideline to install Kestrel in a Python virtual environment with the latest dependent packages.
First, open a terminal in/into the hunting machine, create a clean Python virtual environment, activate it, and update the virtual environment:
$ python -m venv huntingspace
$ . huntingspace/bin/activate
$ pip install -U pip setuptools wheel
Second, install Kestrel runtime with its Jupyter Notebook kernel:
# dependent packages such as `stix-shifter` will be automatically installed by `pip`
$ pip install kestrel-jupyter
$ python -m kestrel_jupyter_kernel.setup
Third, install the Elastic ECS connector of STIX-shifter:
$ pip install stix-shifter-modules-elastic-ecs
Fourth, define environment variables to configure a Kestrel data source container1:
$ export STIXSHIFTER_CONTAINER1_CONNECTOR=elastic_ecs
$ export STIXSHIFTER_CONTAINER1_CONNECTION='{"host":"elastic.ourcloud.com", "port":9200, "indices":"container1-sysflow-*"}'
$ export STIXSHIFTER_CONTAINER1_CONFIG='{"auth":{"id":"VuaCfGcBCdbkQm-e5aOx", "api_key":"ui2lp2axTNmsyakw9tvNnw"}}'
Note that we need to specify the indices as container1-sysflow-* so Kestrel
can correlate telemetry data with alerts (TTP tags) from the two SysFlow
indices.
We can add more data sources from the hybrid cloud. If the new data source goes through Elastic, such as a Windows system monitored by Sysmon as we demonstrated in our Black Hat session, just define a new set of environment variables to set it up:
$ export STIXSHIFTER_LAPTOP1_CONNECTOR=elastic_ecs
$ export STIXSHIFTER_LAPTOP1_CONNECTION='{"host":"elastic.ourcloud.com", "port":9200, "indices":"employee-laptop-1"}'
$ export STIXSHIFTER_LAPTOP1_CONFIG='{"auth":{"id":"VuaCfGcBCdbkQm-e5aOx", "api_key":"ui2lp2axTNmsyakw9tvNnw"}}'
Hello World Hunt in the Hybrid Cloud
Our open hunting stack is ready! Let’s start Jupyter Notebook and hunt. In the terminal where we installed and setup Kestrel runtime:
$ jupyter notebook
Jupyter should report a URL to visit in a browser. We may need to configure Jupyter to enable access from specific/any IP if this is a dedicated hunting server in the cloud.
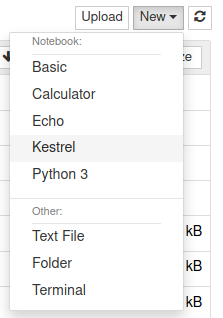
In a browser opening the Jupyter URL, we can create a Kestrel huntbook by choosing the Kestrel kernel under the dropdown menu of New Notebooks.
Let’s write and execute (Shift+Enter) our hello world hunt step on container1:
# get all `ping` processes on Oct 17, 2021 into Kestrel variable `hello`
hello = GET process FROM stixshifter://container1
        WHERE [process:name = 'ping']
        START t'2021-10-17T00:00:00Z' STOP t'2021-10-18T00:00:00Z'
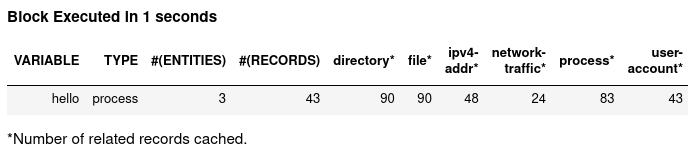
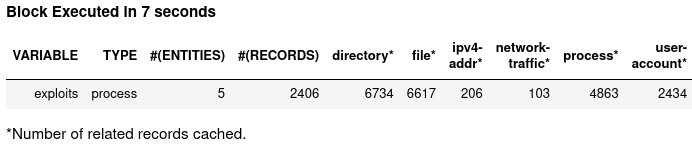
The data pipeline is working. Then let’s test the first hunt step in our Black Hat session using SysFlow TTP tags to simplify complex TTP pattern to write in Kestrel:
exploits = GET process FROM stixshifter://container1
           # The TTP tag simplifies enum `process:name IN ('sh', 'bash', 'csh', ...)`
           # https://attack.mitre.org/techniques/T1059/
           WHERE [process:parent_ref.name = 'node' AND process:x_ttp_tags LIKE '%T1059%']
           START t'2021-10-17T00:00:00Z' STOP t'2021-10-18T00:00:00Z'
And testing the second hunt step in our Black Hat session:
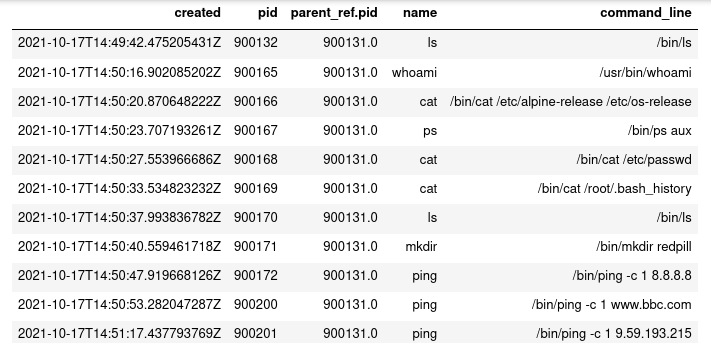
# What did the exploited process do,
#   e.g., did it execute any commands?
#         did it probe the host info?
#         did it established a C&C?
#         did it do anything harmful?
#
# Let's find child processes of the exploited processes and display them chronically

exp_spawn = FIND process CREATED BY exploits
exp_act = GET process FROM exp_spawn WHERE [process:name != 'bash']
exp_act = SORT exp_act BY created ASC
DISP exp_act ATTR created, pid, parent_ref.pid, name, command_line
Then how to rank suspiciousness of processes using SIGMA rules? How to find network traffic of a suspicious process? How to lookup geolocations of IP addresses and pin IP on a map? How to do provenance tracking? How to follow data-flow across network boundaries in a hybrid cloud? How to reveal the root cause of an APT in a Windows machine? Join our Black Hat session to find answers.
Summary
In this blog, we describe an open framework combining SysFlow + ELK + Kestrel for threat hunting in the hybrid cloud presented at Black Hat Europe 2021. For more information on Kestrel, please visit Kestrel. For everything SysFlow related visit sysflow.io.
Want to contribute to SysFlow? Join our slack community!
Until next time, happy threat hunting!